on
appinsights-surefire-action: Project Intro
Most of my career I’ve been building software with the help of Jenkins and it’s predecessor Hudson. Sometimes I’ve just been a consumer of pipelines built by someone else but quite often I have been the one responsible for the configuration.
One plugin that has been a staple of every project, without exception, has been the jUnit plugin that provides a nice graph of test results over time such as demonstrated in the following picture.
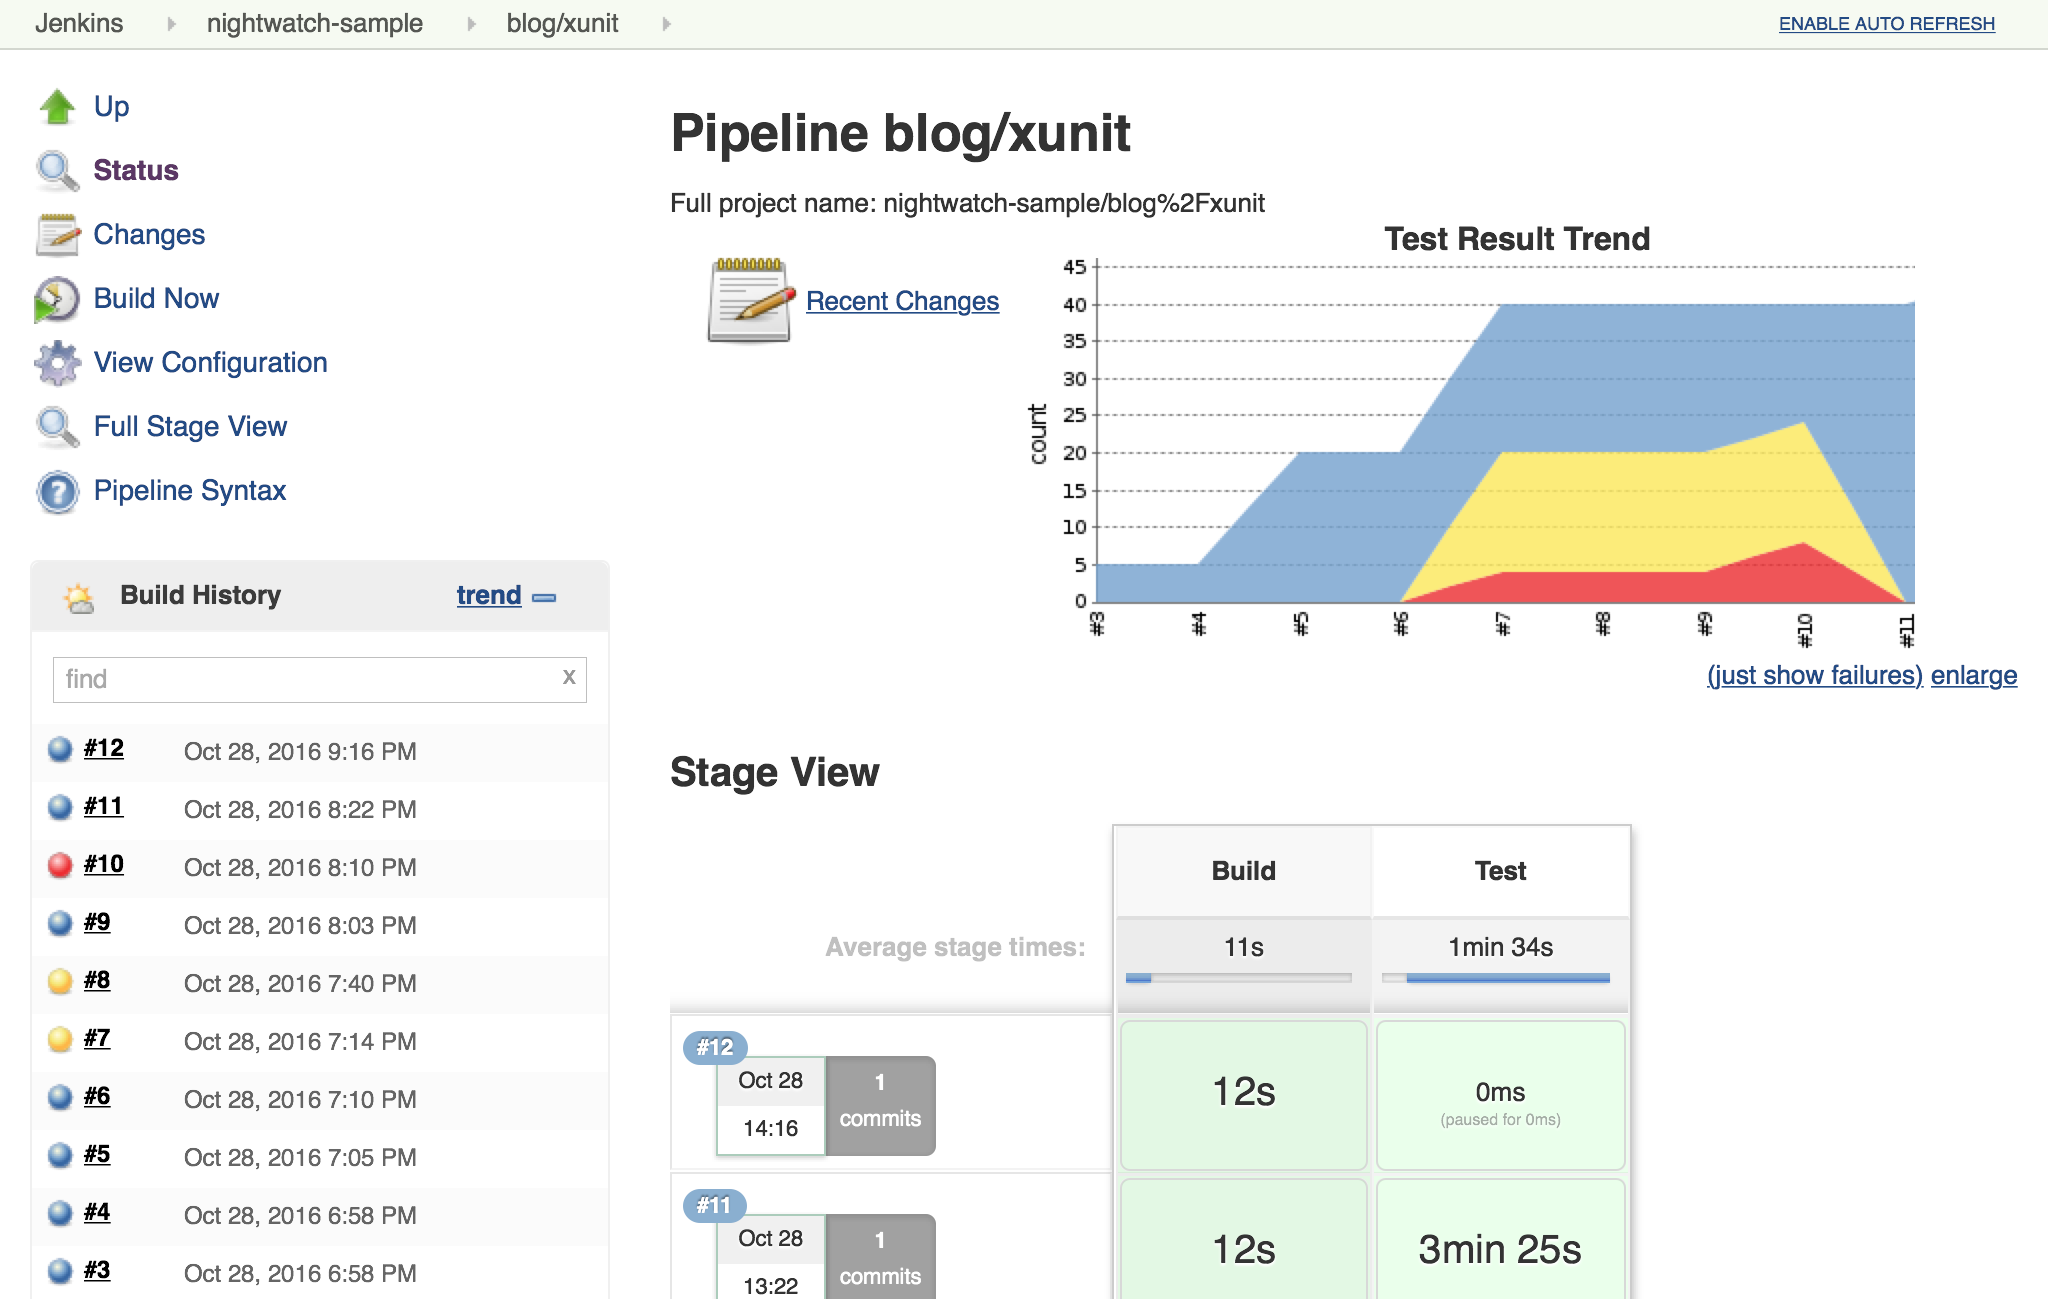
Image source: https://www.jenkins.io/blog/2016/10/31/xunit-reporting/
Futher the Jenins interface also gives you a nice easy way to navigate the test results for a given pipeline run.
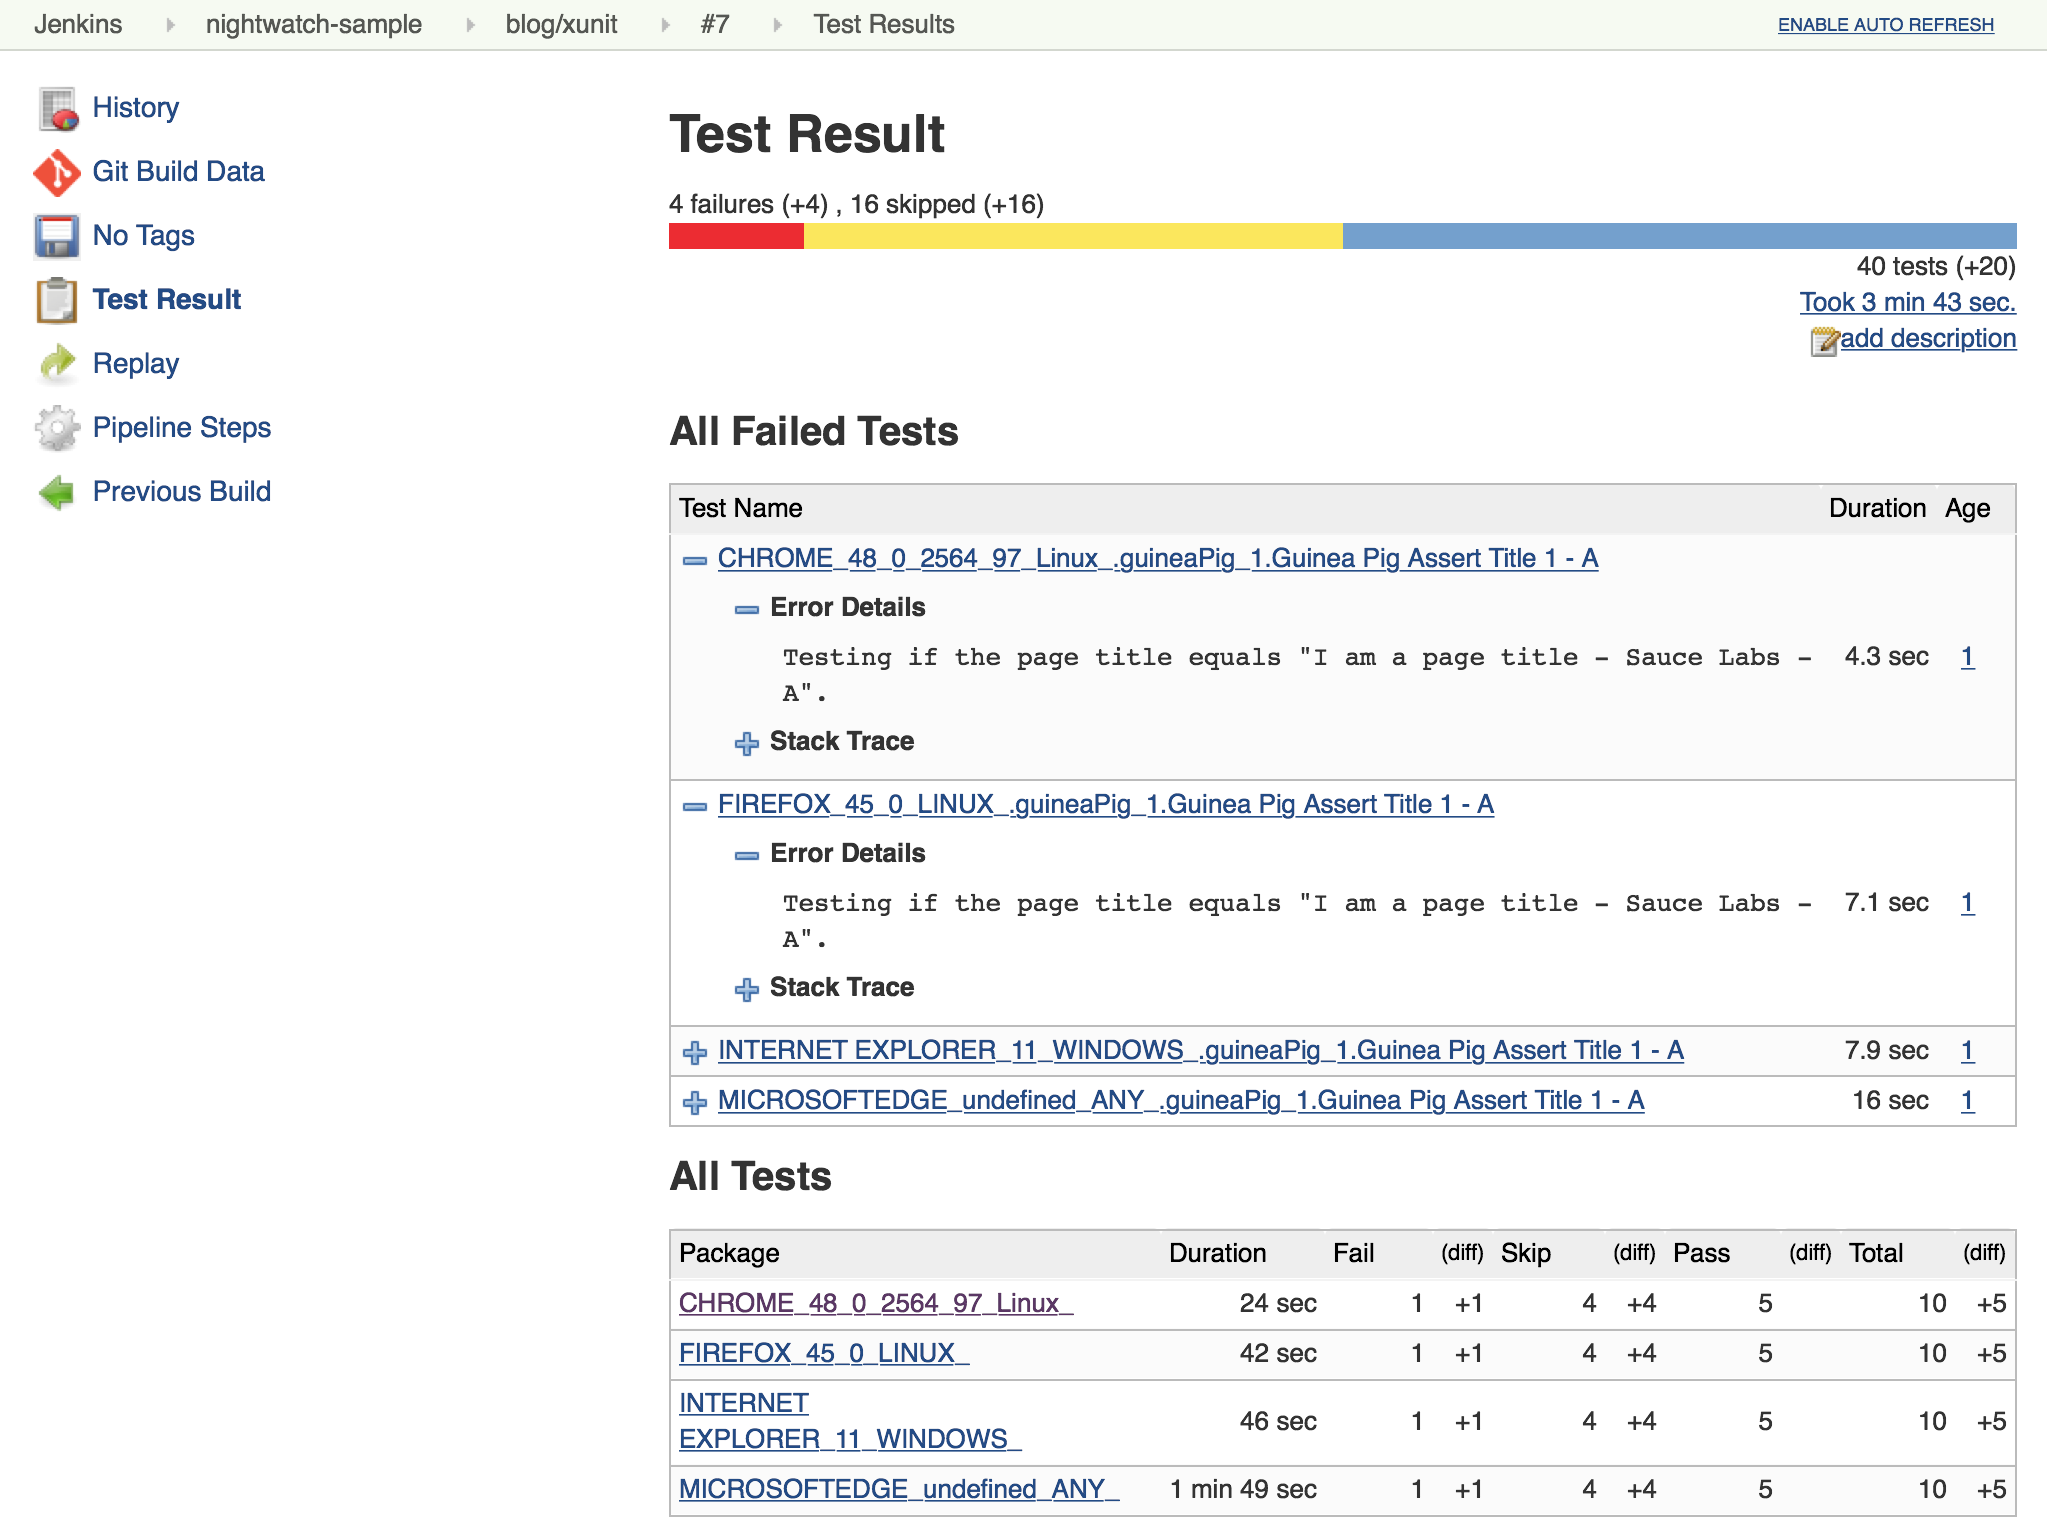
Image source: https://www.jenkins.io/blog/2016/10/31/xunit-reporting/
On my current project we’re following the current trends, making use of GitHub as the source code repository and GitHub Actions for implementing build and deploy pipelines.
GitHub itself doesn’t have any support for displaying test results at all, leaving that as an exercise to the user. The only two options you have for displaying any feedback directly in the GitHub UI would be annotations provided by a GitHub Action and displaying a badge in project’s README file.
Searching the catalogue of community actions for doing something meaningful with unit test reports Surefire Report appears to be the most popular with 45 stars. Drilling down into the action output you can find a simple summary like the following, the annotations are also shown inline in pull-requests.
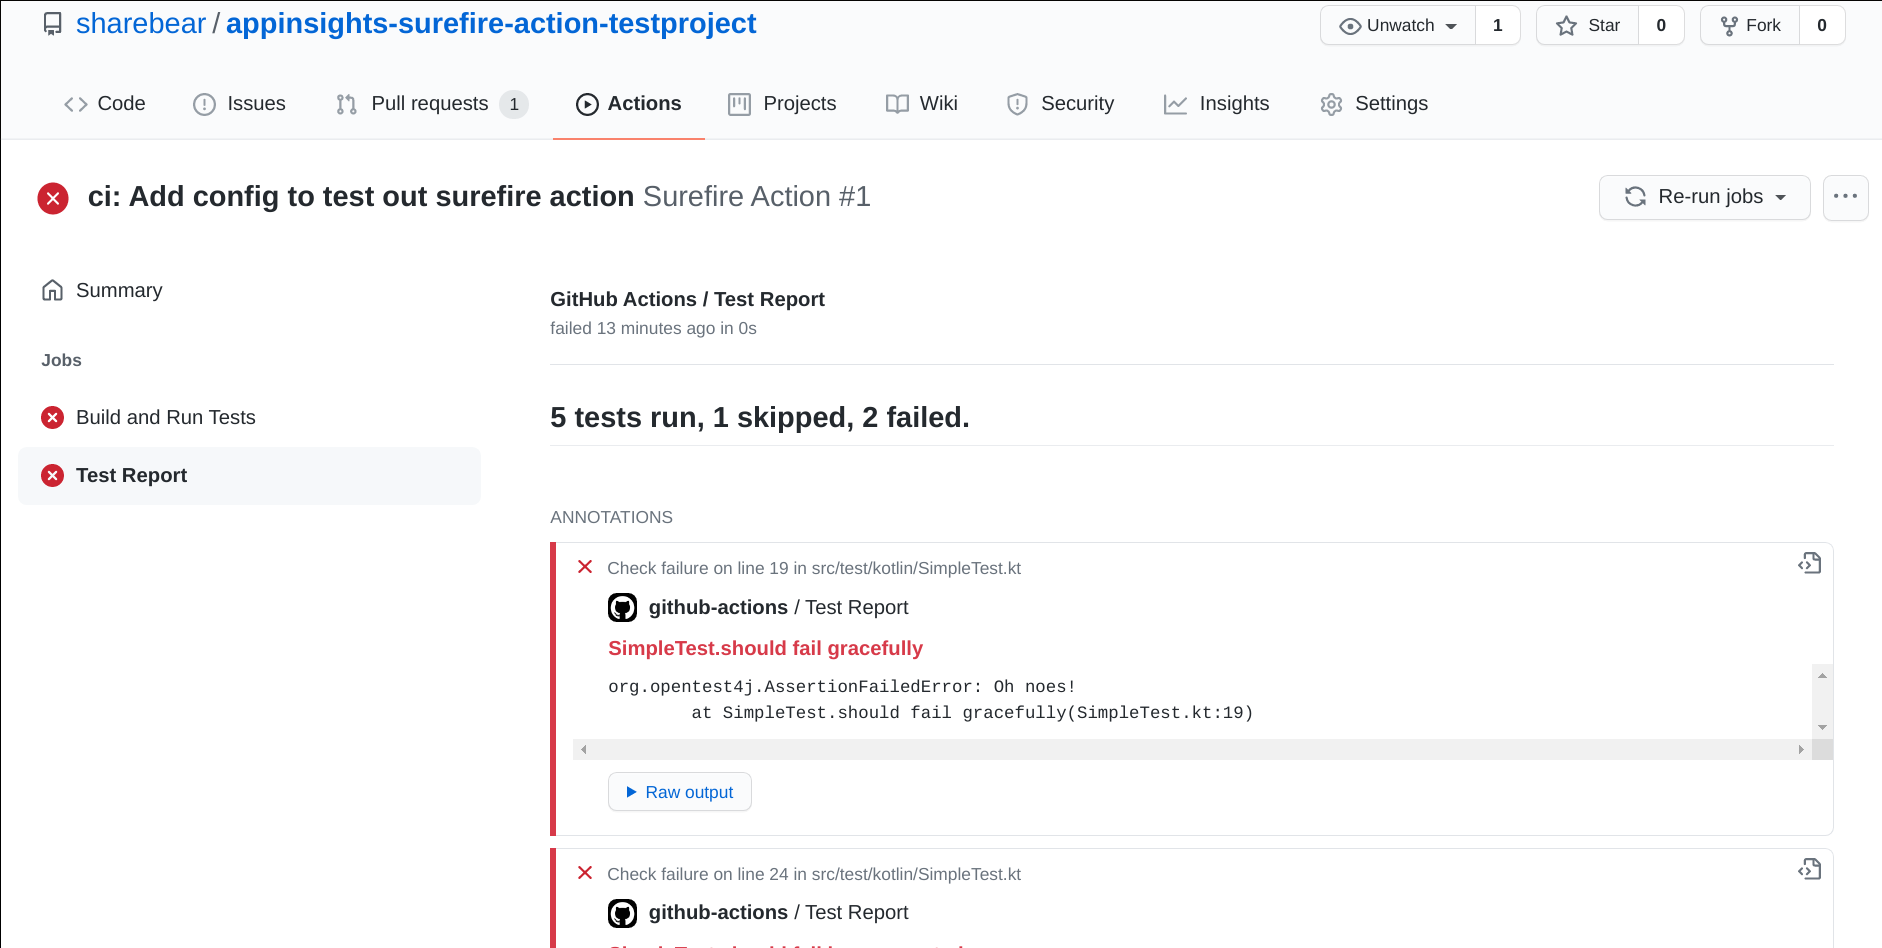
From the perspective of a developer this is good enough to be useful, but I think it’s possible to do better. There’s no way here to visualise the stability of the project over time and the single line summary isn’t very friendly for including in test reports typically required in change management processes.
For creating visualisations based on what is essentially numerical data, I would normally reach for Grafana and indeed there is prior work in this area, but at the moment I’m doing a lot of work with Azure and I thought attempting to present test results in an Azure Dashboard based upon Application Insights metrics would be an interesting use-case to get to know the platform better at the same time as presenting the opportunity to write my first GitHub Action, and so appinsights-surefire-action was born.